How do I filter results and add benchmarks to my Course Evaluation Reports?

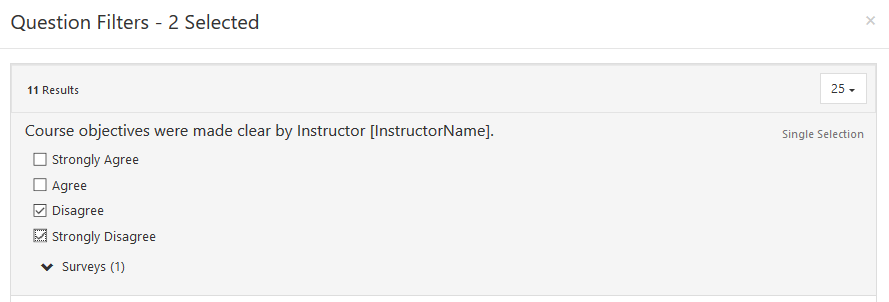
Filter Results by Responses to Survey Questions

  • Using this feature the user can slice and dice the data based on specific responses to one survey question or multiple survey questions. This allows the user to easily view the responses for just a desired segment.

Question Results & Aggregated Results

  • In addition to individual question-level metrics, in Report Builder 2.0 you can easily view data aggregated across multiple questions. Aggregated Results allows you to see a mean score across multiple survey questions, as well as overall percent and frequencies.

    Note: This feature requires questions to have a common scale.

Add Benchmarks to Reports

  • This feature offers the ability to quickly add up to three selected levels of aggregated data in order to benchmark against. For instance, a user can view course-level data and easily compare that to aggregated data from the department, school, and institutional levels.

Filter Results by Student or Respondent, Course, and Instructor Metadata

  • Uploading metadata to courses, students/respondents, or instructors allows you to view survey results based on your segmented metadata. EvaluationKIT Administrators and Administrators can import external data related to these areas into EvaluationKIT, which allows Instructors to easily view the survey results for just the criteria selected related to students/respondents, courses, and/or instructors. External metadata can be brought into EvaluationKIT via API, FTP to Project, and direct upload options. For more on course and user metadata, please consult with your institution’s EvaluationKIT Administrator.

Report Sharing

  • Reports generated by EvaluationKIT Administrators and Administrators can be shared with or emailed to instructors. Shared reports with you can be viewed on your Report Builder 2.0 dashboard.